Chart of the Day: Don't Stay in Cash
Contents
About the Author

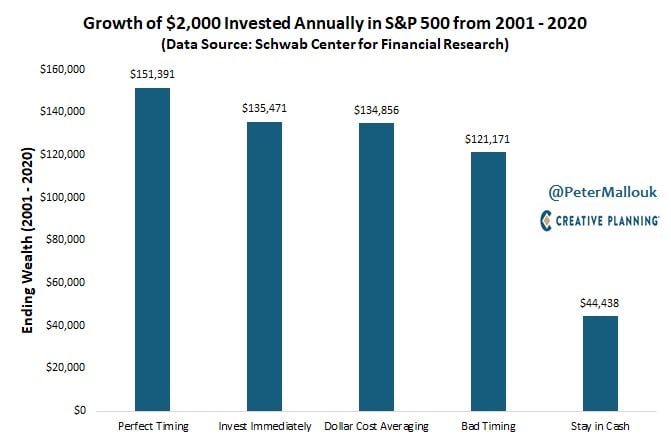
“Time it right,” and “Don’t buy the peak” are attractive goals; however, the chart from @PeterMallouk shows the difference between perfect timing and bad timing over the last 20 years is only $151K vs. $121K.That is only a 20% difference. So, go ahead and hit the buy button. Whatever you do, don’t stay in cash where it only earned $44K.
Samuel serves as Senior Vice President, Chief Investment Officer for the Crews family of banks. He manages the individual investment holdings of his clients, including individuals, families, foundations, and institutions throughout the State of Florida. Samuel has been involved in banking since 1996 and has more than 20 years experience working in wealth management.
Investments are not a deposit or other obligation of, or guaranteed by, the bank, are not FDIC insured, not insured by any federal government agency, and are subject to investment risks, including possible loss of principal.