
Chart of the Day: Every 2.5 Years
Contents
About the Author

Need to upgrade your car or want to buy an RV? Our loans can help meet your needs. Loans subject to credit approval.
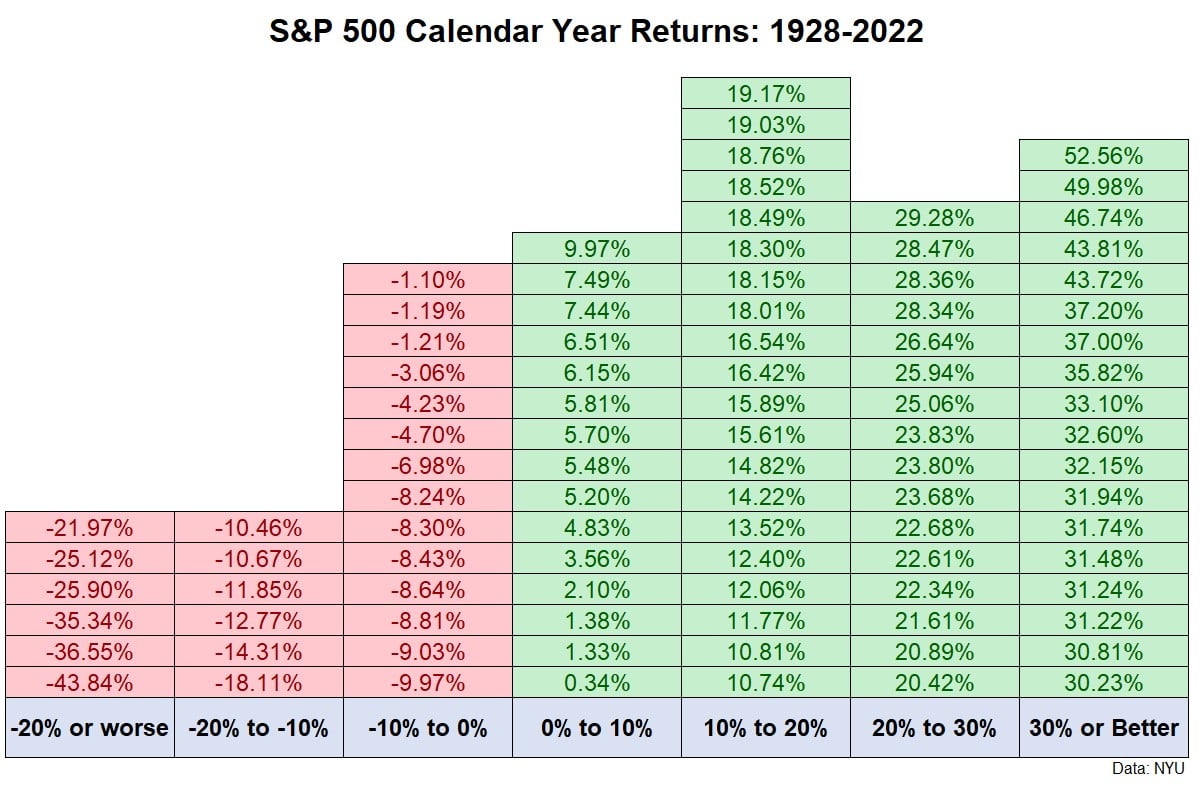
Today's Chart of the Day comes from A Wealth of Common Sense and shows the annual returns of the stock market since 1928. There were 69 positive years versus 26 negative years. This results in a negative year on average of every 2.5 years. For the last few years, we’ve become used to a string of consecutive positive ones, which has made it tough to remember that negative ones are a normal course of business.
Samuel serves as Senior Vice President, Chief Investment Officer for the Crews family of banks. He manages the individual investment holdings of his clients, including individuals, families, foundations, and institutions throughout the State of Florida. Samuel has been involved in banking since 1996 and has more than 20 years experience working in wealth management.
Investments are not a deposit or other obligation of, or guaranteed by, the bank, are not FDIC insured, not insured by any federal government agency, and are subject to investment risks, including possible loss of principal.