Chart of the Day: 1.5 Days a Year
Contents
About the Author

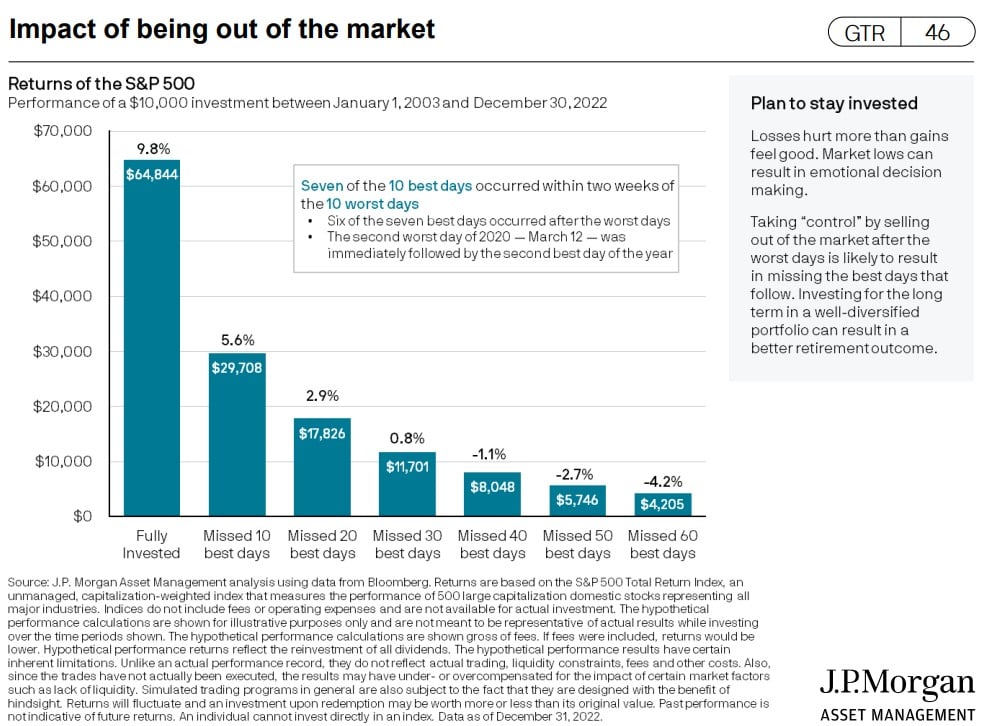
Today’s Chart of the Day is from J.P. Morgan’s updated Guide to Retirement. It calculates your total return having missed the 30 best days for last 20 years ending 2022. It results in a 0.8% return instead of 9.8%. Out of 5,040 trading days, that is only missing 1.5 days each year.
Samuel serves as Senior Vice President, Chief Investment Officer for the Crews family of banks. He manages the individual investment holdings of his clients, including individuals, families, foundations, and institutions throughout the State of Florida. Samuel has been involved in banking since 1996 and has more than 20 years experience working in wealth management.
Investments are not a deposit or other obligation of, or guaranteed by, the bank, are not FDIC insured, not insured by any federal government agency, and are subject to investment risks, including possible loss of principal.